Used MINI Hatch F56 (2014–24) vs Citroen C3 Mk3 (2016–24)
Figures updated
Shopping for a used supermini? We compare the MINI Hatch F56 (2014–2024) and Citroen C3 Mk3 (2016–2024), which were on sale at the same time, on size, boot space, performance, safety and running costs, plus how cars of their age do in real MOT tests.
The short answer
Pick the MINI Hatch F56 for the better MOT record and more performance, or the Citroen C3 Mk3 for the bigger boot and lower fuel costs.
- The Citroen C3 Mk3 has the biggest boot: 300 litres, 89 more than the MINI Hatch F56.
- The MINI Hatch F56 has the better MOT record for its age: the MINI Hatch F56 fails its MOT 27% less often than average for its age (15% of MINI Hatches built 2014–2021 failed first time in 2024, against 21% of all cars that age), while the Citroen C3 Mk3 fails its MOT 14% more often than average for its age (21% of Citroen C3s built 2016–2021 failed first time in 2024, against 18% of all cars that age).
- The Citroen C3 Mk3 is the cheapest to fuel: comparing petrol versions, about £141 a year less than the MINI Hatch F56 at 7,500 miles a year.
- Watch the exhaust and emissions on a MINI Hatch F56: it fails on them 1.4 times as often as the average car.
- Watch the body and structure on a Citroen C3 Mk3: it fails on them 2.5 times as often as the average car.
| Figure | MINI Hatch F56F56 (2014–2024), 3-door hatchback | Citroen C3 Mk3Mk3 (2016–2024), 5-door hatchback |
|---|---|---|
| Price and practicality | ||
| Body | 3-door hatchback | 5-door hatchback |
| Seats | 4 | 5 (best) |
| BootSeats up / folded | 211 litres / 731 | 300 litres / 922 (best) |
| Length | 3,821mm | 3,996mm |
| WidthWithout mirrors | 1,727mm | 1,829mm |
| Height | 1,414mm | 1,474mm |
| Performance | ||
| Power | 95–231 PS (best) | 68–110 PS |
| 0–62mph | 6.1–11.0 sec (best) | 9.3–14.2 sec |
| Safety | ||
| Euro NCAP ratingTests get tougher each year | ★★★★★ (2014) | ★★★★★ (2017) |
| Economy and emissions | ||
| Fuel types | Diesel, Electric, Petrol | Diesel, Petrol |
| Official economyVersions of this generation | 41.5–83.1 mpg | 44.6–78.5 mpg |
| CO2 | 89–147 g/km | 93–143 g/km |
| Electric range | 180–239 miles | – |
| Running costs at 7,500 miles a year | ||
| Petrol or hybrid171.7p a litre, today's UK average | £1,307 (44.8 mpg) | £1,166 (50.2 mpg) (best) |
| Diesel198.4p a litre | £887 (76.3 mpg) (best) | £1,008 (67.1 mpg) |
| Electric, charged at home26.3p per kWh standard tariff | £438 (5 mi/kWh) | – |
| Cheapest version to fuelWhichever fuel costs least | £438 (electric) | £1,008 (diesel) |
| Car tax, registered 2001 to 2017Taxed on CO2; newer cars pay a flat £200 | £20 to £445 | £20 to £325 |
| Reliability from real MOT tests | ||
| Reliability score | 113Above average (best) | 79Well below average |
| Failed first time, cars of this generation's ageUK rate for cars the same age in brackets | 15.1% (20.7%)built 2014–2021 (best) | 21.1% (18.4%)built 2016–2021 |
| Failed MOT first time (ages 3–20) | 24.7% (best) | 35.3% |
| Failed at 3 years old | 10.8% | 9.4% (best) |
| Failed at 5 years old | 12.7% (best) | 16.8% |
| Failed at 10 years old | 23.3% (best) | 38.0% |
| Most common MOT fault | Position lamp (3.9% of tests) | Stop lamp (4.5% of tests) |
| Fails more than average on | Exhaust and emissions (1.4×) | Body and structure (2.5×), Steering (1.8×) |
| MOT tests analysed | 630,667 | 196,261 |
| About the cars | ||
| Type | Supermini | Supermini |
| Owners' average miles a year | 6,500 | 6,600 |
| On sale | 2014–2024 | 2016–2024 |
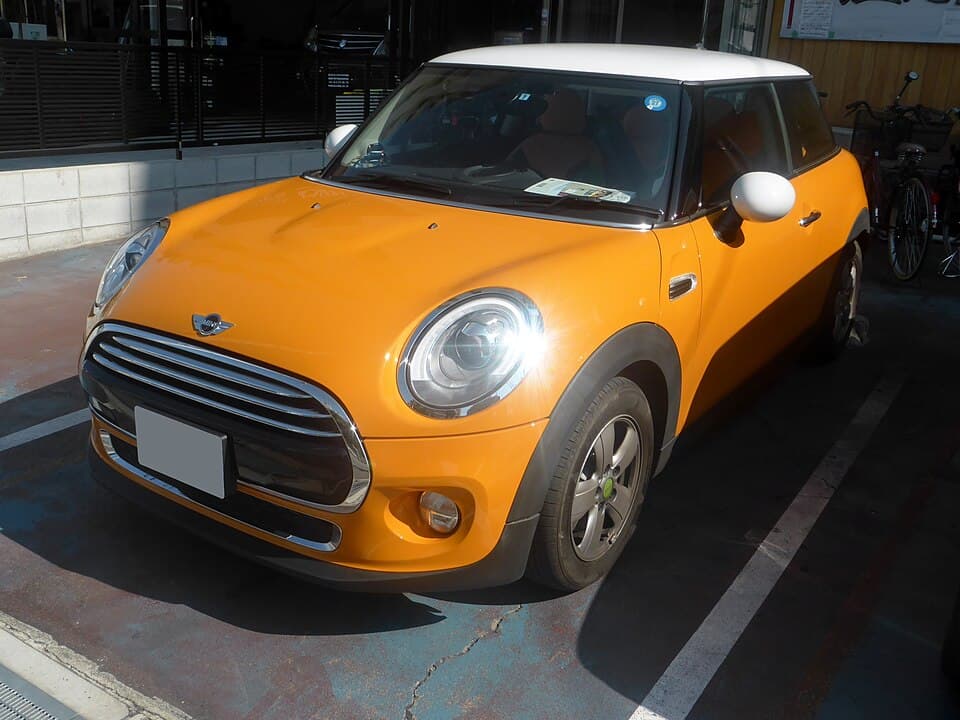
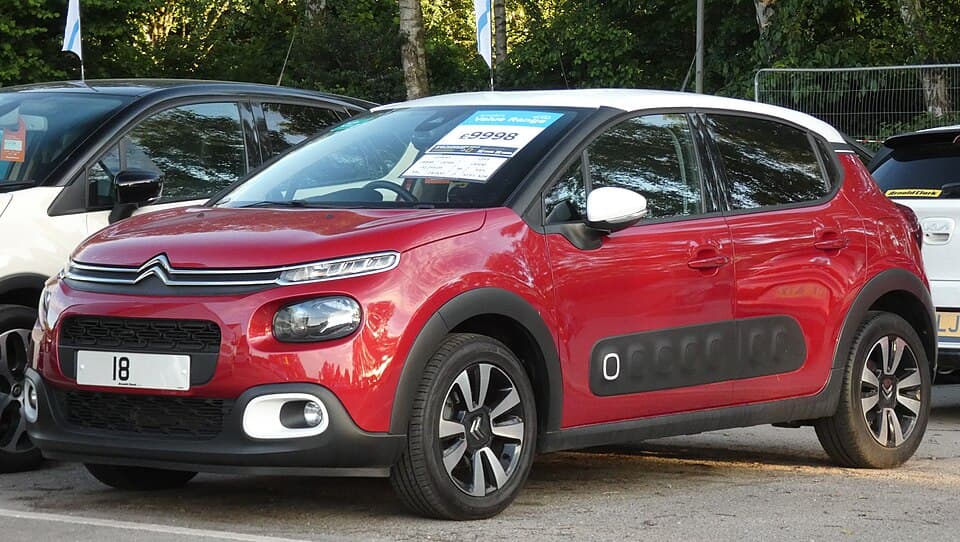
Green marks the better figure where the difference is more than 3%. Reliability figures cover every version of each model tested in the year. Running costs use the typical official economy of recent versions (WLTP where available); real-world economy is usually a little worse for every car.
More comparisons
Frequently asked questions
›Is a used MINI Hatch F56 or Citroen C3 Mk3 more reliable?
The MINI Hatch F56. Compared with all cars the same age, the MINI Hatch F56 fails its MOT 27% less often than average and the Citroen C3 Mk3 14% more often than average (DVSA MOT tests, 2024). Because they're different ages, their raw rates differ: 15.1% of MINI Hatches built 2014–2021 failed first time, and 21.1% of Citroen C3s built 2016–2021. Whatever you buy, check the MOT history of the exact car.
›Which is bigger, the MINI Hatch F56 or the Citroen C3 Mk3?
The Citroen C3 Mk3 is 175mm longer (3,996mm against 3,821mm). The Citroen C3 Mk3 has the bigger boot: 300 litres against 211.
›Which is cheaper to run, the MINI Hatch F56 or the Citroen C3 Mk3?
Comparing petrol versions, the Citroen C3 Mk3 costs about £141 a year less to fuel at 7,500 miles (£1,166 against £1,307), using typical official economy and current UK average fuel prices.
›Which is safer, the MINI Hatch F56 or the Citroen C3 Mk3?
Euro NCAP gave the MINI Hatch F56 4 stars (2014) and the Citroen C3 Mk3 4 stars (2017). Euro NCAP makes its tests tougher every few years, so ratings from different years aren't directly comparable.
›Should I buy the MINI Hatch F56 or the Citroen C3 Mk3?
Pick the MINI Hatch F56 for the better MOT record and more performance, or the Citroen C3 Mk3 for the bigger boot and lower fuel costs. The comparison above sets out price, space, performance, safety, running costs and reliability side by side.
Sources: manufacturers' UK specifications and price lists and Euro NCAP (listed on each model's page); DVSA anonymised MOT tests 2024 (Open Government Licence v3.0); Vehicle Certification Agency car fuel data, © Crown copyright, VCA cannot accept liability for its accuracy; fuel prices from the GOV.UK Fuel Finder scheme. Photos from Wikimedia Commons, credited under each picture.