Volkswagen Polo vs Audi A1
Figures updated
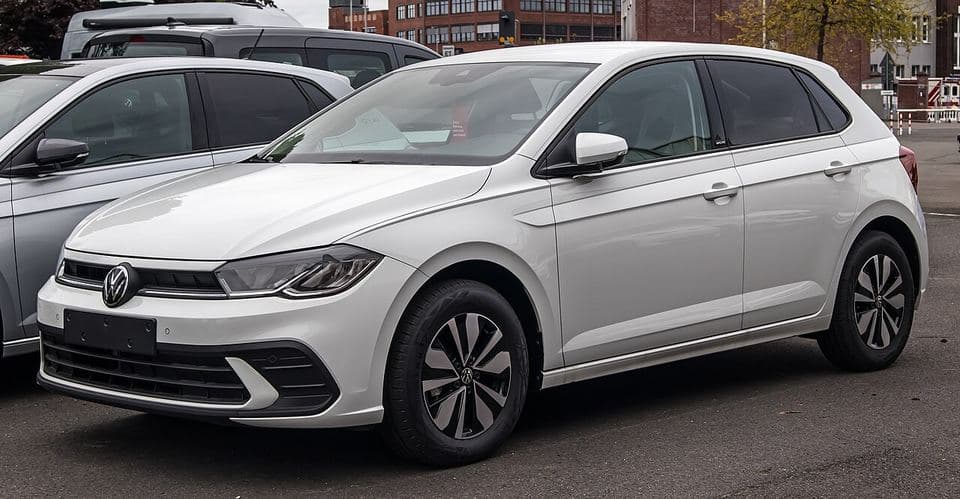
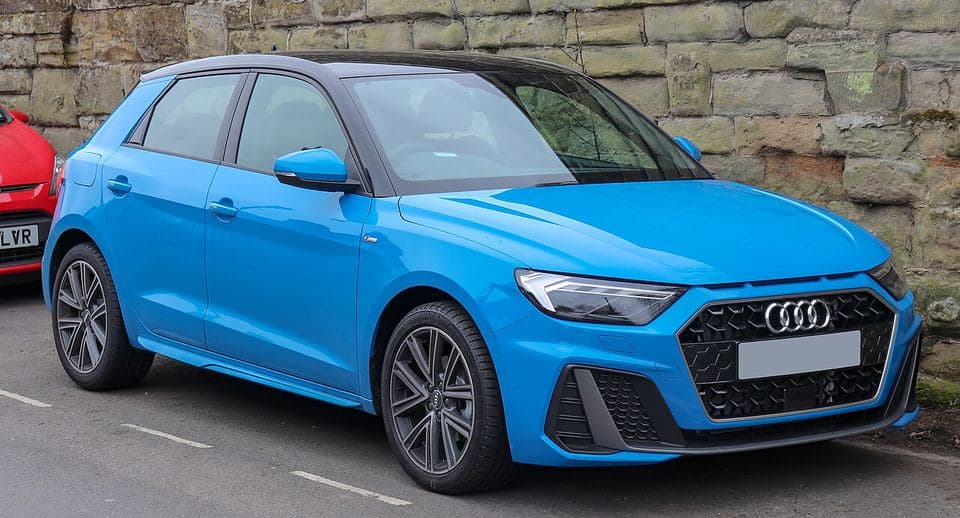
The Volkswagen Polo and Audi A1 are two of the UK's most popular superminis. We compare the Polo Mk6 (2017–) and the Mk2 Sportback (2018–) A1 on price, size, boot space, performance, safety and running costs, plus how reliable each has been across 818,083 real MOT tests.
The short answer
Pick the Volkswagen Polo for lower fuel costs, or the Audi A1 for the better MOT record.
- Their boots are much the same size: Volkswagen Polo 351 litres, Audi A1 335 litres.
- The Audi A1 has the better MOT record. Like for like on age and mileage, the Volkswagen Polo fails its MOT about 20% more often.
- The Volkswagen Polo is the cheapest to fuel: comparing petrol versions, about £64 a year less than the Audi A1 at 7,500 miles a year.
- Watch the steering on a Volkswagen Polo: it fails on them 1.6 times as often as the average car.
| Figure | Volkswagen PoloPolo Mk6 (2017–), 5-door hatchback | Audi A1Mk2 Sportback (2018–), 5-door hatchback |
|---|---|---|
| Price and practicality | ||
| Price newUK list prices, across the range | £22,310 to £28,920October 2026 price list | – |
| Body | 5-door hatchback | 5-door hatchback |
| Seats | 5 | 5 |
| BootSeats up / folded | 351 litres (best) | 335 litres / 1,090 |
| Length | 4,074mm | 4,029mm |
| WidthWithout mirrors | 1,751mm | 1,740mm |
| Height | 1,451mm | 1,409mm |
| Performance | ||
| Power | 80–207 PS | 95–207 PS |
| 0–62mph | 6.5–15.5 sec | 6.5–11.5 sec |
| Safety | ||
| Euro NCAP ratingTests get tougher each year | ★★★★★ (2017) | ★★★★★ (2019) |
| Economy and emissions | ||
| Fuel types | Diesel, Petrol | Diesel, Petrol |
| Official economyVersions of this generation | 43.5–76.3 mpg | 39.2–76.3 mpg |
| CO2 | 97–148 g/km | 97–166 g/km |
| Running costs at 7,500 miles a year | ||
| Petrol or hybrid171.4p a litre, today's UK average | £1,096 (53.3 mpg) (best) | £1,160 (50.4 mpg) |
| Diesel198.4p a litre | £910 (74.3 mpg) | £934 (72.4 mpg) |
| Cheapest version to fuelWhichever fuel costs least | £910 (diesel) | £934 (diesel) |
| Car tax a yearCars registered from April 2017 | £200 | £200 |
| Reliability from real MOT tests | ||
| Reliability score | 87Below average | 104Above average (best) |
| Failed MOT first time (ages 3–20) | 32.9% | 23.2% (best) |
| Failed at 3 years old | 11.8% | 10.3% (best) |
| Failed at 5 years old | 19.9% | 14.4% (best) |
| Failed at 10 years old | 34.3% | 28.7% (best) |
| Most common MOT fault | Pins and bushes (3.1% of tests) | Pins and bushes (3.5% of tests) |
| Fails more than average on | Steering (1.6×), Body and structure (1.5×) | Nothing stands out |
| MOT tests analysed | 600,518 | 217,565 |
| About the cars | ||
| Type | Supermini | Supermini |
| Owners' average miles a year | 6,700 | 7,500 |
| On sale | 2017 on | 2018 on |
Green marks the better figure where the difference is more than 3%. Reliability figures cover every version of each model tested in the year. Running costs use the typical official economy of recent versions (WLTP where available); real-world economy is usually a little worse for every car.
More comparisons
Frequently asked questions
›Is the Volkswagen Polo or the Audi A1 more reliable?
The Audi A1. Like for like on age and mileage, the Volkswagen Polo fails its MOT about 20% more often (reliability scores 104 and 87, where 100 is average). 23.2% of Audi A1s and 32.9% of Volkswagen Polos failed first time in 2024.
›Which is bigger, the Volkswagen Polo or the Audi A1?
The Volkswagen Polo is 45mm longer (4,074mm against 4,029mm). Their boots are much the same: 351 and 335 litres.
›Which is cheaper to run, the Volkswagen Polo or the Audi A1?
Comparing petrol versions, the Volkswagen Polo costs about £64 a year less to fuel at 7,500 miles (£1,096 against £1,160), using typical official economy and current UK average fuel prices.
›Which is safer, the Volkswagen Polo or the Audi A1?
Euro NCAP gave the Volkswagen Polo 5 stars (2017) and the Audi A1 5 stars (2019). Euro NCAP makes its tests tougher every few years, so ratings from different years aren't directly comparable.
›Should I buy the Volkswagen Polo or the Audi A1?
Pick the Volkswagen Polo for lower fuel costs, or the Audi A1 for the better MOT record. The comparison above sets out price, space, performance, safety, running costs and reliability side by side.
Sources: manufacturers' UK specifications and price lists and Euro NCAP (listed on each model's page); DVSA anonymised MOT tests 2024 (Open Government Licence v3.0); Vehicle Certification Agency car fuel data, © Crown copyright, VCA cannot accept liability for its accuracy; fuel prices from the GOV.UK Fuel Finder scheme. Photos from Wikimedia Commons, credited under each picture.